
Gráficos
Graphing Options in MonitorPro
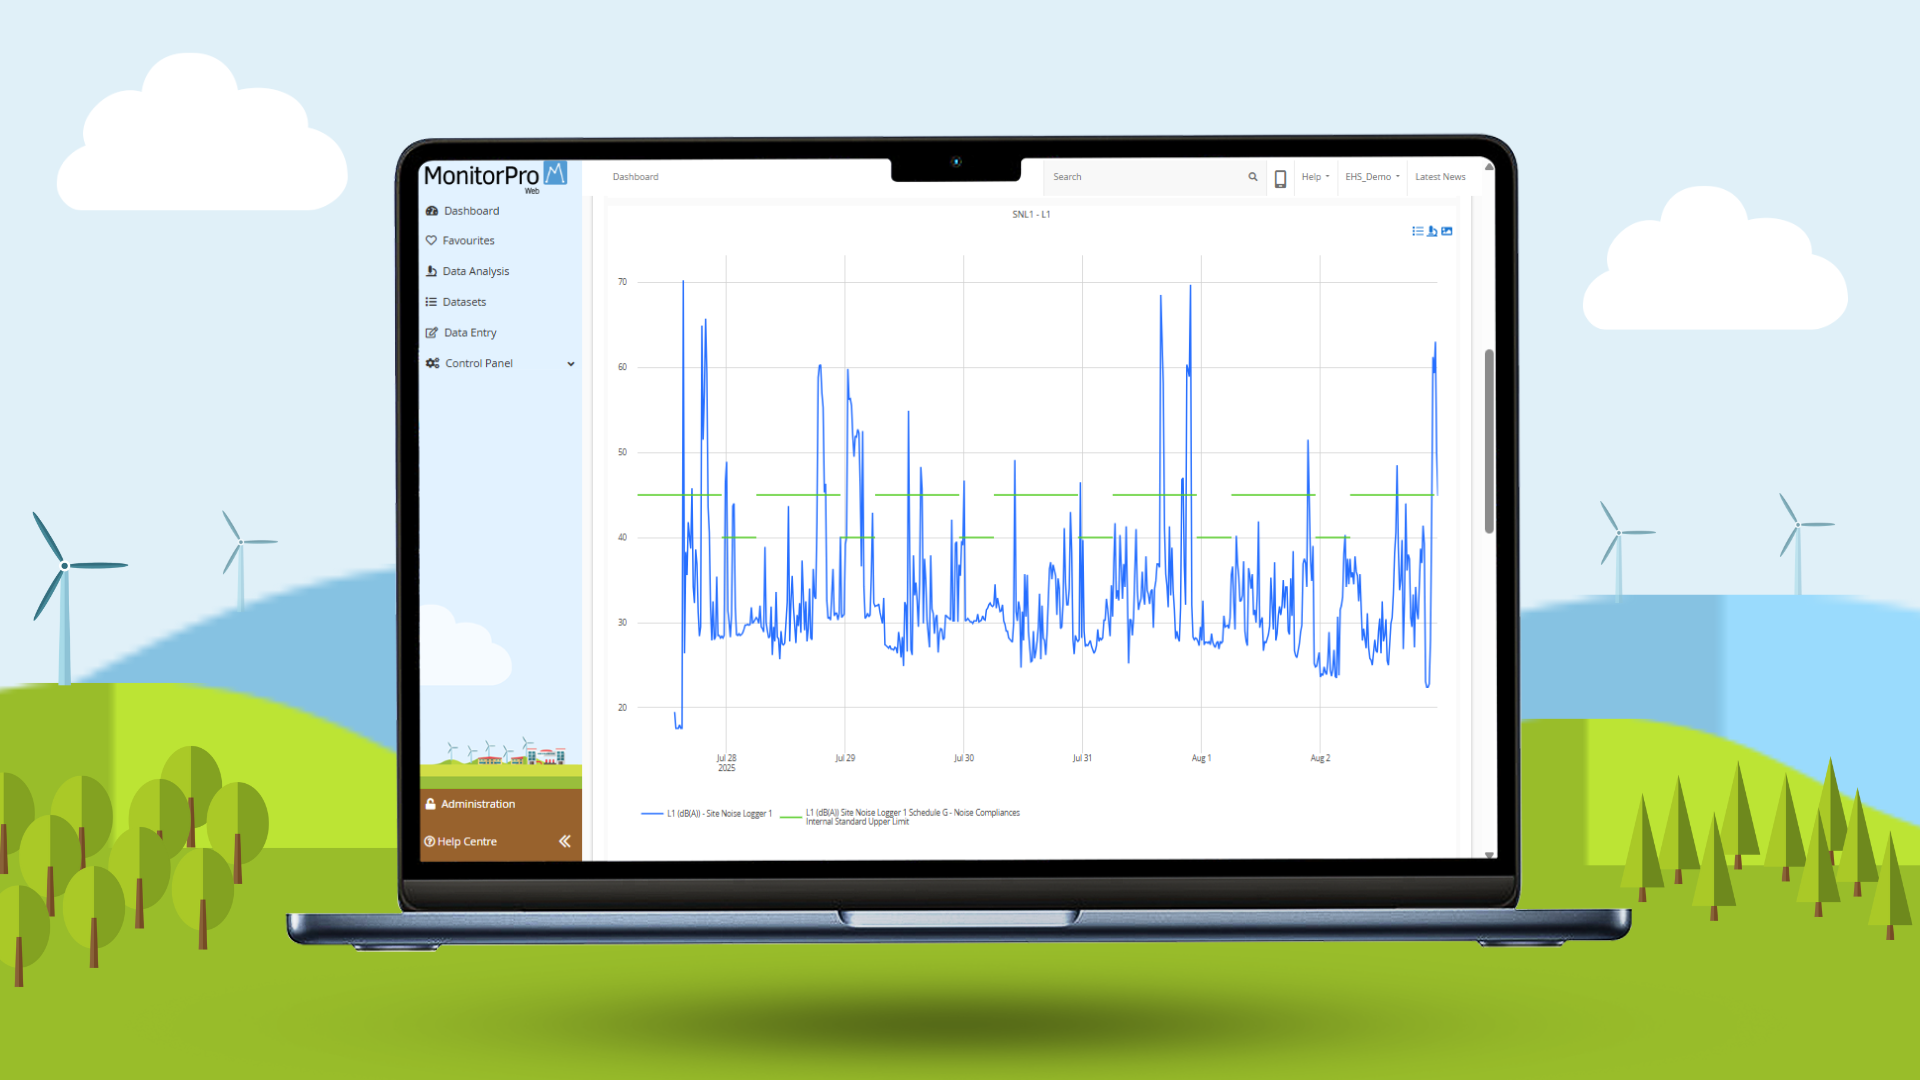
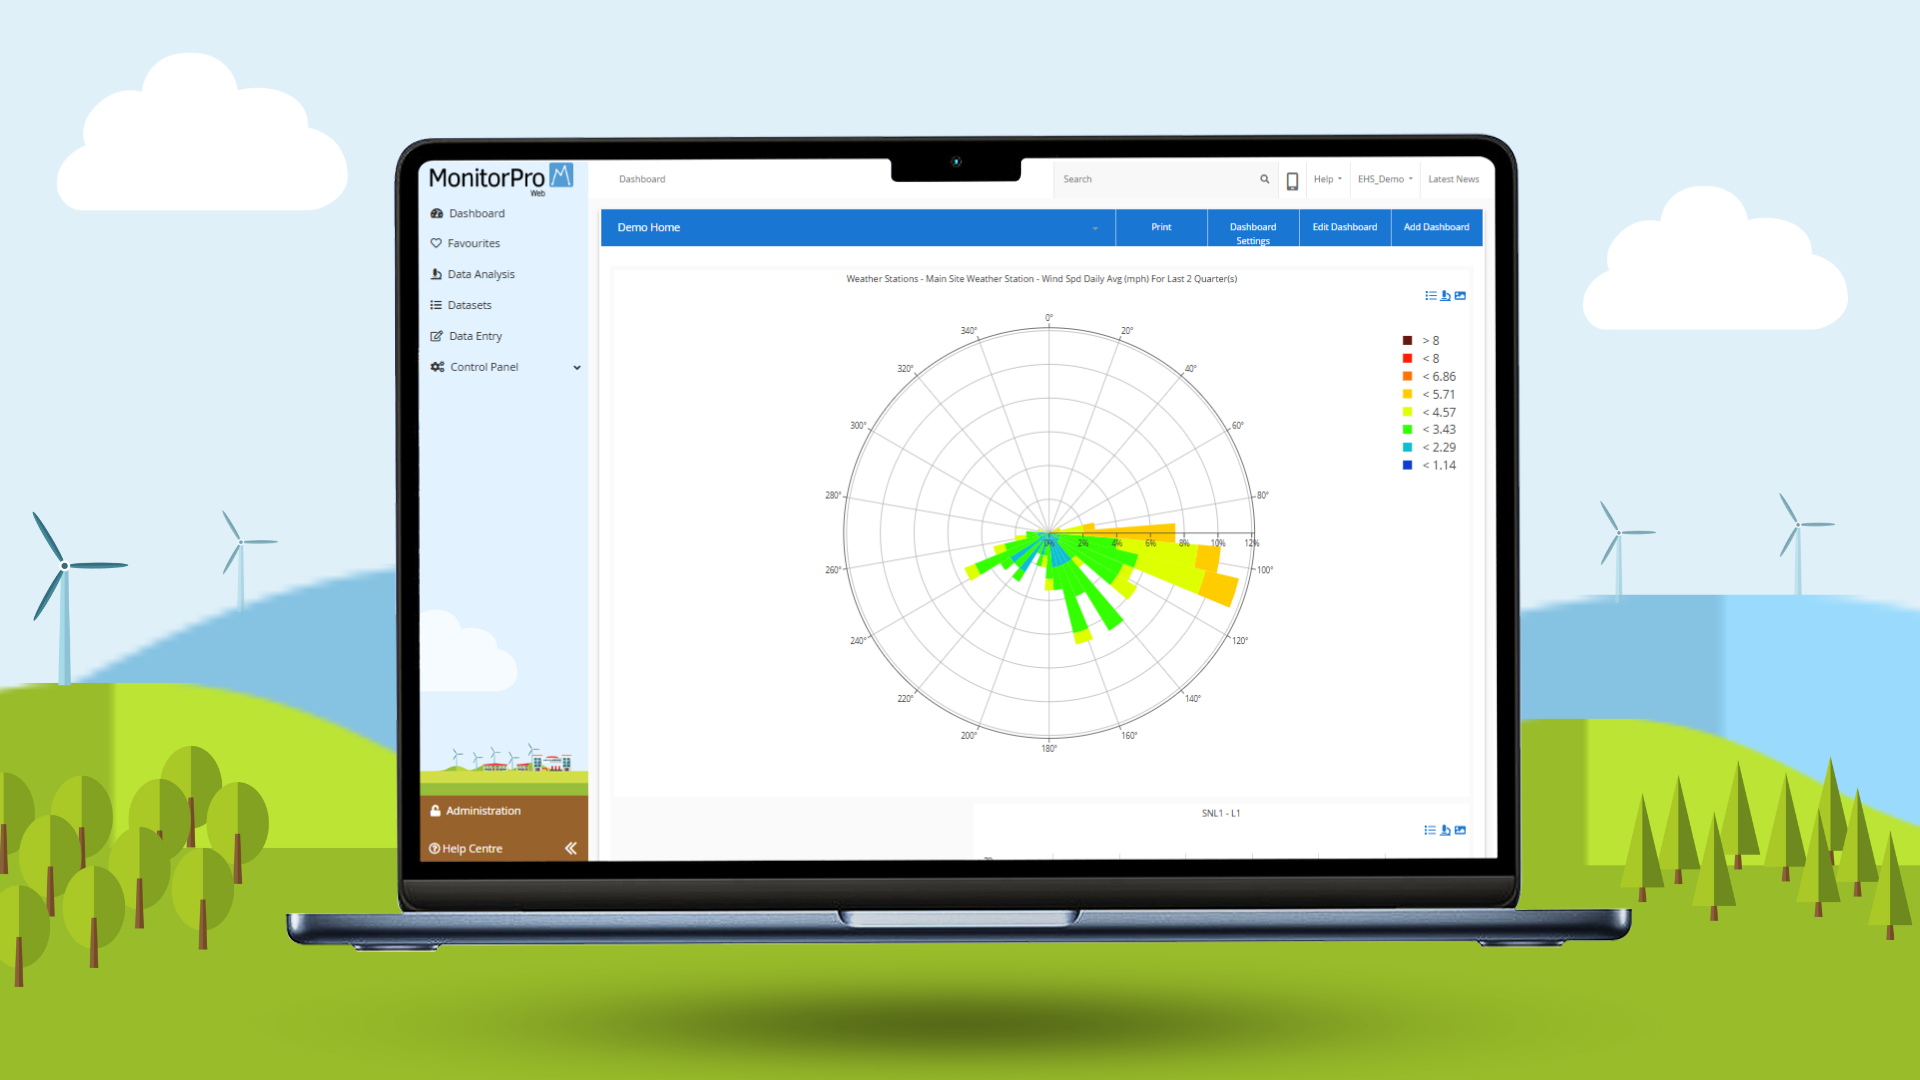
MonitorPro gives you powerful graphing, which is simple to use. Whether it be weather, noise, dust, groundwater or any other data, MonitorPro offers users simple ways to best present their data.
Data can be summarised on the fly to produce weekly, daily, monthly or yearly summaries. Once outputs have been created, users can customise them further before adding them to a shared dashboard. From the dashboard, it will be continually updated automatically with the latest data entered.
- Graphing options, including scatter, line, bar, pie, combo, and polar, guide the user through creating output quickly and easily.
- Users can further control graphing customisation such as compliance limits, scale, secondary/primary axis and titles.
- Plan, manage and report strategic data quickly and effortlessly.
”This data is collected from a number of operational and restored Landfill sites and is made up of both field readings and laboratory analysis. Much of it is collected to fulfil Environmental Permit requirements which are regulated by the Environment Agency (EA).
Andrew NashWaste Management Client
¿Quiere saber más?
Interested in finding out more about our graphing options in MonitorPro? Contact us at enquiries@ehsdata.com. Want to know how MonitorPro could help your business? check out our benefits of MonitorPro page.
Volver a más funciones de MonitorPro
Datos clave de MonitorPro
200
+
Clientes en todo el mundo
3000
+
Usuarios de todo el mundo
25
+
Años de experiencia
MonitorPro EnMoDS Export for BC, Canada
The British Columbian ministry have changed the way in which data is submitted to their online portal, previously this was completed using EMS but this has now been updated to…
Seguir leyendo